ŞEKİL ANALİZİ VE MORFOMETRİ ÇALIŞMA GRUBU
YAYINLARIMIZ
Senem Turan OZDEMIR, Ilker ERCAN, Fatma Ezgi CAN,
Gokhan OCAKOGLU, Ezgi DEMIRDOGEN CETINOGLU, Ahmet URSAVAS
Three-Dimensional Analysis of Craniofacial Shape in Obstructive Sleep Apnea
Syndrome Using Geometric Morphometrics
International Journal of Morphology (Kabul edildi)
Craniofacial morphology is a risk factor for obstructive sleep apnea syndrome. The general aim of this study was to investigate the craniofacial shape differences in adults with and without OSAS using geometric morphometric methods. A descriptive study conducted 106 adult Turkish subjects, consisting of 50 patients with OSAS diagnosed by polysomnography and 56 non-OSAS controls. Three dimensional craniofacial scanning process were performed on patients subjects on the same day as the PSG. Twelve standart craniofacial landmarks were collected from each subject�s 3D craniofacial scan. Geometric morphometric analysis was used to compare the craniofacial shape differences between the OSAS and non-OSAS control groups. No statistically significant difference in terms of general shape in face shapes was found between the OSAS group and control group. However local significance differences were found. There were significant differences between the groups in some of the interlandmark distances: 11% of the interlandmark distances were greater in OSAS patients, and 29% were greater in controls. Greater measured distances in OSAS are concentrated in the nasal region. In the control group, the difference is not concentrated in a specific region. Given the relationship of craniofacial structural alterations and sleep disordered breathing, we hypothesized that inter-landmark distance measurements in the craniofacial anatomy of patients might be predictive of OSA.
Senem Turan OZDEMIR, Fatma Ezgi CAN,
Sefa ISIKLAR, Ilker ERCAN, Nedim Simsek CANKUR
Periorbital Soft Tissue Anthropometric Analysis of Turkish Young Adults
Journal of Craniofacial Surgery, 2017, 28(4):311-318
We aim to determine the periorbital soft tissue anthropometric norms for
Turkish young adults for right and left eyes using a noninvasive 2D
photogrammetric analysis. Anthropometric measurements of the periorbital
soft tissue were taken from 172 female and 56 male Turkish adults aged
between 18 and 24 years. The periorbital soft tissue profiles (ocular and
palpebral) for males and females were digitally analyzed using linear
measurements made with standardized photographic records, taken in a natural
head position. A statistically significant differences were found ocular
soft tissue measurements according to gender except inner intercanthal
distance (p=0.125) and right horizontal palpebral aperture (p=0.240). A
statistically significant differences were found for palpebral soft tissue
measurements according to gender except right pretarsal skin height(p=0.112) and
left pretarsal skin height (p=0.056). Results were compared with other
ethnic groups. Normal periorbital soft tissue measurements are fundamental
anatomical parameters utilized in ophthalmology, optometry, ophthalmic
industry, oculoplastic surgery, clinical genetics, dermatocosmetology.
Further, normal anthropometric measurements generate reference data for
studies in craniofacial dysmorphology, oculoplastic surgery,
dermatocosmetology and comparative physical anthropology.
Gokhan OCAKOGLU, Mevlut Ozgur TASKAPILIOGLU,
Ilker ERCAN, Aylin BICAN DEMIR, Bahattin HAKYEMEZ, Ahmet BEKAR, Ibrahim BORA
Statistical shape analysis of temporal lobe in mesial temporal sclerosis
patients.
Acta Neurochirurgica, 2015, 157(11):1897-1903
Surgery is regarded as a common treatment option for patients with mesial temporal lobe epilepsy due to hippocampal sclerosis but sometimes deciding this diagnosis can be very hard. We aim to investigate the shape differences in the temporal lobe of mesial temporal sclerosis epilepsy patients compared with healthy controls, investigating the side difference and if present to assess the clinical application of this situation.The MRI scans of the mesial TLE patients, and controls, were retrospectively reviewed. Temporal lobe data were collected from the two-dimensional digital images. Standard anthropometric landmarks were selected and were marked on each digital image using TPSDIG 2.04 software. Eight anatomic landmarks were marked on images. A generalized Procrustes analysis was used to evaluate the shape difference. The shape deformation of the temporal lobe from control to patient was evaluated using the TPS method.There are statistically significant TL shape differences between groups. The high level deformations for left and right side from control to patient group were seen in TPS graphic. Highest deformation was determined at the inferior lateral temporal, midpoint of middle temporal gyri and superior temporal landmarks points of both right and left sides. Our study for the first time demonstrated temporal shape differences in TLE patients using a landmark-based geometrical morphometric method, by taking into consideration the topographic distribution of TL.
Deniz SIGIRLI, Ilker ERCAN
Examining the efficiency of models using tangent coordinates or principal component scores in allometry studies.
Interdisciplinary Sciences: Computational Life Sciences. (2015) 7:3: 249-256
Most of the studies in medical and biological sciences are related with the examination of geometrical properties of an organ or organism. Growth and allometry studies are important in the way of investigating the effects of diseases and the environmental factors effects on the structure of the organ or organism. Thus statistical shape analysis has recently become more important in the medical and biological sciences. Shape is all geometrical information that remains when location, scale and rotational effects are removed from an object. Allometry, which is a relationship between size and shape, plays an important role in the development of statistical shape analysis. The aim of the present study was to compare two different models for allometry which includes tangent coordinates and principal component scores of tangent coordinates as dependent variables in multivariate regression analysis. The results of the simulation study showed that, the model constructed by taking tangent coordinates as dependent variables is more appropriate than the model constructed by taking principal component scores of tangent coordinates as dependent variables, for all sample sizes.
Ilker ERCAN, Deniz SIGIRLI, Guven OZKAYA
Examining the Variations in the Results of the Hotelling T2 Test in Case of
Changing Baseline Landmarks in the Bookstein Coordinates.
Interdisciplinary Sciences: Computational Life Sciences, (2015) 7:2:186�193
In many biological and biomedical investigations, the most effective way to analyze the forms of whole biological organs or organisms is by recording geometric locations of landmark points. If we want to compare shapes, then individuals should be translated, rotated and scaled in such a way that all of the individuals lie in a standard position and are centered. Bookstein conducted this process by choosing two landmarks as reference landmarks. Each individual is translated, rotated and scaled according to these reference landmarks. The aim of the present study is to examine the change in the p values in the case of choosing different baseline landmarks when performing the Hotelling T 2 test, which is commonly used when comparing two sample shape configurations based on Bookstein coordinates. For this purpose, the changes in the p values were investigated in shape configurations that are composed of a different number of landmarks by taking all of the possible paired landmark combinations at different variance levels and sample sizes. As a result of the present study, it was observed that, with the increase in the landmark number, the number of possible baseline landmark combinations also increases and, for this reason, a substantial number of variations occur in the p values. Therefore, it is an important to decide which landmarks should be taken as reference landmarks when using the Bookstein coordinates.
Ilker ERCAN , Levent SARIKCIOGLU , HEATHER SMITH ,
JUAN A. SANCHIS-GIMENO, TUNCAY PEKER, GULSUM OZYIGIT.
Quantitative Anatomical Studies
BioMed Research International, vol. 2015,Article ID 781590, 2 pages, 2015.
This special issue of this journal highlights newdevelopments mainly in the
field of quantification of the data of anatomical studies. In this special
issue, we reviewed and edited seventeen articles from broad ranges of
anatomical studies.
Nevin UTKUALP, Ilker ERCAN
Anthropometric Measurements Usage in Medical Sciences
BioMed Research International vol. 2015, Article ID 404261, 7 pages, 2015.
Morphometry is introduced as quantitative approach to seek information concerning variations and changes in the forms of organisms that described the relationship between the human body and disease. Scientists of all civilization, who existed until today, examined the human body using anthropometric methods. For these reasons, anthropometric data are used in many contexts to screen for or monitor disease. Anthropometry, a branch of morphometry, is the study of the size and shape of the components of biological forms and their variations in populations. Morphometrics can also be defined as the quantitative analysis of biological forms. The field has developed rapidly over the last two decades to the extent that we now distinguish between traditional morphometrics and the more recent geometric morphometrics. Advances in imaging technology have resulted in the protection of a greater amount of morphological information and have permitted the analysis of this information. The oldest and most commonly used of these methods is radiography. With developments in this area, CT and MRI have also been started to be used in screening of the internal organs. Morphometric measurements that are used in medicine, are widely used in the diagnosis and the follow-up and the treatment of the disease, today. In addition, in cosmetology use of these new measurements is increasing every day.
Meryem ETOZ, Senem TURAN OZDEMIR, Deniz SIGIRLI, Ahmet E. DEMIRBAS, Ilker ERCAN, Osman A. ETOZ, Yıldıray SISMAN
Evaluation of Bony Structures on Panoramic Radiographs with Statistical Shape Analysis in Patients with Temporomandibular Joint Pain and Limited Mouth Opening
e-Journal of Dentistry
2013 3(4):495-500
Background: In the present study, it is aimed to investigate the shape variability of the condyle and the surrounding skeletal structure between the patients with pain and limited movement in temporomandibular joint and controls. Methods: A generalized Procrustes analysis was used to obtain the mean shapes of the cases and controls. Bootstrap based Hotelling T2 test was performed to compare the mean shapes of two groups. Results: There were not statistically significant differences in condylar shape and surrounding skeletal structure between symptomatic cases and controls. Conclusions: The locational differences at the hard tissues of the patients which does not have an explicit bone deformity but have temporomandibular joint (TMJ) pain and dysfunction, does not play an important part in pathogenesis of internal derangements of TMJ.
Keywords: Temporomandibular joint/Condylar shape/Statistical Shape Analysis/Geometric Morphometrics
Gokhan Ocakoglu, Ilker ERCAN
Type I error rate for two-sample tests in statistical shape analysis.
Hacettepe Journal of Mathematics and Statistics, 2014; 41(3):141-152
Nowadays, with the help of advanced imaging techniques the image or shape of an organ or organism can be used as input data. Therefore, the statistical analysis of shape has recently become more important in the medical and biological sciences. Methods related to two-sample tests have been developed for statistical shape analysis, giving rise to considerable interest in research that evaluates the performance of these tests. In this study, two sample procedures are used to compare the mean shapes from the statistical shape analysis literature according to type I error rate.
Keywords: Statistical shape analysis, two-sample tests, type I error rate.
Guven Ozkaya, Gulsum Ozyigit, Ilker Ercan,Ilker Arican
Comparing the Hearts of German shepherd and Mongrel Dogs Using Statistical Shape Analysis
Pakistan Veterinary Journal 2013; 33(2): 187-90.
The aim of this study was to conduct a statistical shape analysis of the heart of dogs and to compare this data between German Shepherd and Mongrel dogs. An effective way to examine these shapes is to record the locations of certain points on the object. In this study, 10 hearts were collected from each breed. EDMA and TPS techniques were used to examine genus-based changes in the shape of the heart. The shape deformations were expressed using expansion and compression grids. There was no statistically significant difference with respect to the general shape of the heart between the genera. However, there were local shape differences between the genera in some of the inter-landmark distances: 6% of the inter-landmark distances were greater in German Shepherd dogs, and 11% were greater in Mongrels. There are no heart shape differences between genera, although significant differences were found between the upper part of the left ventricle and the lower part of the right ventricle. The upper part of the left ventricle in Mongrels showed more enlargement than in German Shepherds. The lower part of the right ventricle in Mongrels had more enlargement than in German Shepherds; however, the middle part of the right ventricle of German Shepherds had more enlargement than in Mongrels. Although there were some local significant shape differences between the upper part of the left ventricle and the lower part of the right ventricle, however, there were no general heart shape differencesbetween German Shepherd and Mongrel dogs.
Key words: Cardiomyopathy, German Shepherd dog, Heart, Mongrel Dogs
Sigirli D, Ercan I
Examining Growth with Statistical Shape Analysis and Comparison of Growth Models
The Journal of Modern Applied Statistical Methods
2012; 11(2):479-92.
Growth curves have been widely used in fields of biology, zoology and medicine by assessing some measurable trait of an organism, such as height, weight, area or volume. Differently, in statistical shape analysis, the size measure is obtained using the geometrical information of an object, rather than considering linear measurements. In this study, we compared the performances of the commonly used non-linear growth curves by taking centroid size as a size measure using a simulation study. Furthermore, a practical example was given for examining the relationship between the centroid size of the cerebellum and disease duration in multiple sclerosis patients.
Key words: Centroid size, Growth models, Statistical shape analysis.
Sigirli D, Ozdemir ST,Ercan I, Taskapilioglu O, Hakyemez B, Sener DK, Zarifoglu M.
Statistical Shape Analysis of the Corpus Callosum and the Cerebellum in Migraine Patients
Turkiye Klinikleri J Med Sci 2013;33(1):200-9
The aim of this study was to investigate the shape differences in the corpus callosum and cerebellum of the migraine patients compared with healthy controls and to assess whether migraine attack frequency and disease duration are indicators for brain abnormalities in migraineurs. This study was conducted using the magnetic resonance imaging scans of 25 control subjects, 38 migraine patients. The data were obtained from the coordinate of landmarks analyzed with statistical shape analysis. A generalized Procrustes analysis was used to evaluate the shapes. Witelson subdivision was used to assess regional shape differences better in corpus callosum. The CC shape of controls was significantly different from the CC shape of the migraine patients while the global shape of the corpus callosum showed significant differences between the two groups. Deformations observed from controls to migraine patients for the corpus callosum. In the deformation from controls to migraine patients, the most prominent deformations were seen in the posterior midbody of corpus callosum. Deformation in much lesser extent was seen in the rostral body according to Witelson subdivisions. This study did not show any global or regional shape di?erence between patients with migraine and controls for cerebellum. In addition, there was no found any signi?cant correlation between the size and disease duration or frequency of migraine attacks, both for corpus callosum and cerebellum. The data suggest that migraine su?erers have global structural changes in CC but not in cerebellum, or that any deformations may vary with the disease progress.
Sigirli D,Ercan I.
Growth and Allometry in Modern Morphometrics
Türkiye Klinikleri Journal of Biostatistics 2013; 5(1).
In traditional shape analysis, linear distance, angles and ratios of measurements are used in multivariate statistical analyses. The challenge in any analysis of growth is to extend quantitative description and to explore aspects of the biology of a given organism, such as the genetic basis of morphogenesis, the phylogenetic underpinnings of developmental patterns, or the role of hormones, teratogens, dietary elements, and other environmental variables on the growth process. It is important to define the growth process with mathematical equations that include biologically meaningful parameters. Size has several different meanings such as length, area, volume, and even the linear combinations of different measured quantities. However, in statistical shape analysis, size is obtained by a specific approach, which provides the geometrical information of an object. Allometry theory was developed as a result of shape variations that occur with the growth of an organism’s different parts or organs at different rates. As the idea of size and shape has been one of the most controversial subjects in traditional morphometrics, allometry (relationship between size and shape) plays an important role in the development of statistical shape analysis. The quantities used in traditional morphometrics for size are highly correlated with shape. Thus, many different methods have been proposed for size correction. However, because of disagreement regarding relevant methods of size correction, researchers have investigated different methods for the analysis of shape data. Today, new geometrical morphometric approaches are being used extensively to explore and model growth and allometry.
Ocakoglu G, Ercan I.
Traditional and modern morphometrics.
Turkiye Klinikleri Journal of Biostatistics 2013; 5(1).
Morphometrics, a branch of morphology, is the study of the size and shape components of biological forms and their variation in the population. In biological and medical sciences, there is a long history of attempts to quantitatively express the diversity of the size and shape of biological forms. On the basis of historical developments in morphometry, we address several questions related to the shape of organs or organisms that are considered in biological and medical studies. In the field of morphometrics, multivariate statistical analysis is used to rigorously address such questions. Historically, these methods have involved the analysis of collections of distances or angles, but recent theoretical, computational, and other advances have shifted the focus of morphometric procedures to the Cartesian coordinates of anatomical points. In recent years, in biology and medicine, the traditional morphometric studies that aim to analyze shape variation have been replaced by modern morphometric studies. In the biological and medical sciences, morphometric methods are frequently preferred for examining the morphologic structures of organs or organisms with regard to diseases or environmental factors. These methods are also preferred for evaluating and classifying the variation of organs or organisms with respect to growth or allometry time dependently. Geometric morphometric methods are more valid than traditional morphometric methods in protecting more morphological information and in permitting analysis of this information
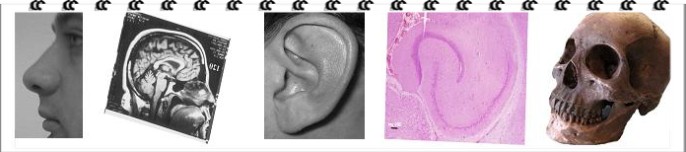
Ocakoglu G, Ozdemir ST, Ercan I, Etoz A.
The shape of the external human ear: a geometric morphometric study.
Turkiye Klinikleri J Med Sci 2013;33(1):184-90
The aim of this study was to identify the shape variability of the external ear. Variability in the shape of the ear was evaluated based on the type of ear, gender and side in terms of the shape of the helix and antihelix & concha. In this study, a landmark-based geometric morphometric technique was used to analyze the external shape of the ear. This study was conducted in 330 (177 females and 153 males) volunteer young adults, with an age range of 18–24 years. All of the data were obtained from standardized digital photographic images taken from the right and left sides of the face. The data from the landmark coordinates were analyzed using statistical shape analysis. Classification of the earlobes was done according to the angle between the earlobe and the cheekIn accordance with this classification in our study, ear type classification was done as type I (tapering-acute angle), type II (square-right angle) and type III (pendulous-obtuse angle) according to the appearance of lobule. There were significant differences between the gender groups for right and left side separately regarding the shapes of the helix and the shape of antihelix & concha in type I ears. There were significant differences between type I and type II ears for right and left side separately regarding the shapes of the helix and the shape of antihelix & concha in females. The present study serves as a guide to future clinical studies by demonstrating localized variations in the components of the ear that constitute the overall shape of the ear.
Baskan EB, Ercan I,Ozdemir ST, Ozkaya G,Yilmaz M, Ozgenel Y, Saricaoglu H.
A Case of Parry-Romberg Syndrome: Examining Efficacy of Lipofilling By Statistical Shape Analysis.
Turkiye Klinikleri Journal of Medical Sciences 2013;33(1):284-9
Parry-Romberg Syndrome is an acquired progressive hemifacial atrophy characterized by atrophy of subcutaneous fat and bone. Aim of this study is to demonstrate the degree of facial asymmetry before and after treated with systemic azathioprine and autologous lipofilling. We present here a dramatic case of Parry-Romberg Syndrome with central nervous system involvement that was treated with systemic azathioprine and autologous lipofilling. The statistical shape analysis was performed on anatomic landmarks to demonstrate the degree of facial asymmetry before and after therapy. On the face of the subject, 32 anthropometric landmarks on the anterior aspect of the face were defined. Thin-plate spline analysis was performed. Before Thin-plate spline analysis, right side of the photo was superimposed on the left side on the midsagittal plane and Bookstein coordinates were calculated. After systemic azathioprine and autologous lipofilling, analysis results are evaluated according to references of the community. Results are so closed to community value in the 64% (9/14) of asymmetry area, but 29% (4/14) of them are departed from community value. Facial atrophy seen after Parry-Romberg Syndrome can include all tissue planes in different grades of severity. Several treatments have been developed to correct this deformity. It has been demonstrated that lipofilling has decreased the asymmetry to a degree close to healthy population.
Sigirli D, Ercan I, Ozdemir, S. T., Taskapilioglu O., Hakyemez B., Turan O.F.
Shape analysis of the corpus callosum and the cerebellum in female MS patients with different clinical phenotypes.
The Anatomical Record: Advances in Integrative Anatomy and Evolutionary Biology. Epub 2012 May 14.
The aim of this study was to investigate the shape differences in the corpus callosum (CC) and cerebellum of female relapsing-remitting multiple sclerosis (RRMS) and secondary progressive multiple sclerosis (SPMS) patients compared with healthy controls. This study was conducted using the magnetic resonance imaging scans of 15 control subjects, 26 RRMS, and 14 SPMS patients. The data obtained from the landmark coordinates were analyzed with statistical shape analysis. The landmarks that were chosen to determine the shape differences of the CC and cerebellum have been identified and used in previous studies. In addition to these landmarks, constructed landmarks were determined and used to assess regional shape differences better. The shapes of the CC and cerebellum showed statistically significant differences from the controls when compared with both the RRMS and SPMS patients. It was found that the deformation observed from controls to SPMS was greater than the deformation from controls to RRMS, both for the CC and cerebellum. In conclusion, this study revealed CC and cerebellar shape change in RRMS and SPMS, and showed that deformations both in CC and cerebellum advances with the disease progression.
Ozkaya G, Taskapilioglu O, Ercan I.
Statistical shape analysis of handwriting of patients with multiple sclerosis
Turkiye Klinikleri Journal of Medical Sciences 2012;32(6):1702-9
The aim of the present study was to determine the alterations in the handwriting characteristics of multiple sclerosis patients acquired along a year at three different time points by using statistical shape analysis. The handwriting samples of multiple sclerosis patients and control subjects were taken at three different time points. Statistical shape analysis of handwriting characteristics was performed. Principal coordinate analysis was applied to tangent coordinate which derived from Procrustes analysis. Analysis of the handwriting samples at different time points suggested that upper case letters, both in the same box and in separate boxes, showed more changes in MS patients. Lower case letters in the same box showed more changes in MS patients while lower case letters in separate boxes showed more changes in the control subjects.There are very few studies about analysis of handwriting by statistical shape analysis. In recent years, it is observed that there has been considerable interest in the statistical analysis of shape. This study has imaginative aspects as it analyzed the handwriting characteristics of MS patients by using statistical shape analysis for the first time. We hope this study to enable further studies using this method of application.
Ercan I, Ocakoglu G, Sigirli D, Ozkaya G.
Statistical Shape Analysis and Usage in Medical Sciences.
Turkiye Klinikleri Journal of Biostatistics, 2012;4(1):27-35
Most of the studies in medicine are releated with the examination of geometrical properties of an organ or organism. Commonly, quantitative or qualitative data sets in the statistical analysis consisted of measuring values, today's an organ or organism's appearance or shape began to be used as input data by the development of imaging techniques. In recent years, it is observed that there has been considerable interest in the statistical analysis of shape. Statistical shape analysis is a geometrical analysis of the statistics measured from sets of shapes that determines the features of similar shapes or of different groups comprising similar shapes. Distance between shapes, mean shape and shape variation can be predicted and obtained using statistical shape analysis. Two groups comparison, asymmetry, growth and allometry studies can be given as example for the most used statistical shape analysis applications.Thin Plate Spline analysis, Procrustes analysis and Euclidean Distance Matrix Analysis can be given as examples of frequently used methods in statistical shape analysis.Examining shape differences between groups, shape deformation, examining asymmetry, classification, growth and allometry studies can be given as examples of statistical shape analysis applications in medicine. The last two decades, a growing interest in the use of statistical shape analysis has been observed in the field of medicine. The main reasons for statistical shape analysis is used widely in medicine are advances in imaging technology, and tendency to investigate the effects of diseases and the environmental factors effects on the structure of the organ or organism.
Colak C, ERCAN I, Dogan M, Ozdemir ST, Sener S, Alkan A.
Detecting the Shape Differences of the Corpus Callosum in Behçet's Disease by Statistical Shape Analysis.
The Anatomical Record: Advances in Integrative Anatomy and Evolutionary Biology, 2011 May;294(5):870-874
The aim of this study was to assess the shape differences of the corpus callosum (CC) in patients with Behçet's disease using statistical shape analysis (SSA). Additionally, an attempt was made to investigate the changes in CC size according to disease duration. Twenty-five adults with clinically diagnosed Behçet's disease and 25 age- and gender-matched controls were examined by high-resolution structural magnetic resonance imaging. The data obtained from the coordinate of landmarks were analyzed with Euclidean distance matrix analysis and a thin-plate spline analysis. SSA and growth curve models were performed to investigate group differences and to fit the curves. A significant difference was determined between CC shape of Behçet patients and controls (P = 0.006). Based on the analysis, a decrease occurred in the CC size of the Behçet patients as the duration of disease increased. Maximum deformations were determined in the landmarks of interior notch of the splenium, inferior tip of the splenium, posterior-most point of the CC, and topmost point of the CC. Similarly, the landmark of anterior-most point of the CC was identified as having the minimum deformation. Behçet patients had significantly different CC shapes from control subjects. The results suggest that SSA is a promising tool for distinguishing Behçet patients from normal subjects, and that it can give useful information to assist clinicians.
Ozdemir ST, ERCAN I, Ozkaya G, Cankur NS, Erdal YS.
Geometric Morphometric Study and Cluster Analysis of Late Byzantine and Modern Human Crania.
Collegium Antropologicum 2010;34 (2): 493-99.
Inter-population variation of cranial morphology, which plays an important role in human evolution studies and biological research, can be studied morphologically and metrically. Geometric morphometry compares body forms using specific landmarks determined by anatomical prominences. The aim of this study was to identify cranial shape differences between the crania of Byzantium period humans and modern humans. Variability in cranial shape was examined using the geometric morphometric technique based on landmark coordinates. Landmark coordinate data were collected from two-dimensional digital photogrammetry and were analyzed using generalized Procrustes analysis, hierarchical clustering and thin-plate spline analysis.
Ak Sonat F, ERCAN I, Ozdemir ST, Ozkaya G, Noyan B.
StatisticalShape Analysis of the Rat Hippocampus in Epilepsy
Anatomical Science International, 2009 Dec; 84:298-304.
In this study, we aimed to (1) propose landmarks for the hippocampus in a rat brain using an experimental study and (2) investigate hippocampus shape changes in a rat brain with epilepsy using the statistical shape analysis method. We have used the statistical shape analysis method to illustrate hippocampal shape deformation due to epilepsy. Statistical shape analysis is of increasing interest to the neuroimaging community because of its potential for locating morphological changes. Nineteen rat brains (ten healthy and nine epileptic) with hematoxylin and eosin images of the hippocampus were used. The results strongly indicated that the normalized hippocampal shape of the epileptic group was different from the nonepileptic group; deformation was seen most significantly in the medial regions of the cornu ammonis (CA1 and CA3) of the hippocampus. In conclusion, our landmark-based methodology detected regional differences in the hippocampus in epilepsy. This study may serve as an initial reference for future studies on shape alteration of the hippocampus associated with certain medical conditions.
Ozdemir ST, Sigirli D, ERCAN I, Cankur NS.
Photographic Facial Soft Tissue Analysis of Healthy Turkish Young Adults: Anthropometric Measurements
Aesthetic Plastic Surgery,2009 Mar; 33:175-184.
The purpose of this study was to establish facial soft tissue norms for Turkish young adults. Anthropometric measurements of the facial soft tissue were taken from 281 female and 149 male of Turkish adults aged between 18-24 years. The soft tissue facial profiles were digitally analyzed using linear (17 vertical and 10 horizontal) measurements made with standardized photographic records, taken in natural head position, to determine average soft tissue facial profile for males and females. A statistically significant difference was found between the male and female in 20 of our 27 measures taken (p<0.001). The most prominent differences between sexes were observed in the measurements taken from the face region. Results were compared with other ethnic groups.
ERCAN I, Ocakoglu G, Guney I, Yazici B.
Adaptation of Generalizability Theory for Inter-Rater Reliability for Landmark Localization
International Journal ofTomography & Statistics, 2008 Jun, Vol. 9, No. S08:51-58
Our study on inter-rater reliability for landmark localization is designed to observe the consistency in locating landmarks of the same or different rater replication on two or three dimensional forms. In the study, the input for the calculation of inter-rater reliability for landmark localization is the Euclidean distance of all landmarks located by the raters. We calculated the reliability coefficient for two-facet crossed design (landmark pairs-by-rater-by-subject) based on the Generalizability Theory (GT). In GT, the score reliability for relative (norm-referenced) interpretations is referred to as the generalizability (G-) coefficient.
(Landmark güvenirliği
MATLAB yazılımı kullanılarak ya da
web sayfası üzerinden hesaplanabilir)
ERCAN I, Ozdemir ST, Etoz A, Sigirli D, Tubbs RS, Loukas M, Guney I
Facial asymmetry in young healthy subjects evaluated by statistical shape analysis
Journal of Anatomy, 2008 Dec;213(6):663-9.
Statistical shape analysis, a relatively a new method for biological research, compares body forms by using specific landmarks determined by anatomical prominences. In this study, we aimed to identify normal facial asymmetry between the right and the left sides of the face. Facial landmark data were collected from two-dimensional digital images of 321 young healthy subjects (150 males and 171 females). These data were analysed using Euclidean distance matrix analysis. The number of significantly asymmetric linear distances between the two halves of the face was greater in females than in males. We found that the left side of the face was most commonly dominant in both males and females. Such data may be useful in establishing a database for future similar studies.
Etoz BC, Etoz A, ERCAN I
Nasal shapes and related differences in nostril forms: a morphometric analysis in young adults.
Journal of Craniofacial Surgery,2008 Sep;19(5):1402-8.
Being aware of the morphologic differences in the nasal anatomy between men and women during the cosmetic rhinoplasty is essential because feminization of a male nose is not a very rare complication. Although there is no difference in the techniques of male and female rhinoplasty, the anthropometric differences have to be considered. This morphometric study evaluated the nasal shapes in both sexes and the related differences in the nostril forms. The nostril forms were separated into 4 main groups such as teardrop, heart shaped, round, and triangular. In this landmark-based morphometric study, significant relations of nostril forms to the nasal shape, frontonasal, and nasolabial angles were found. The results of this study should make us think about these relations of nostril forms to the nasal shapes and should be a basement for further clinical studies enhancing the plans of the corrective surgery.
Ozdemir ST , ERCAN I, Sevinc O, Guney I, Ocakoglu G, Aslan E, Barut C.
Statistical Shape Analysis of Differences in the Shape of the Corpus Callosum Between Genders
The Anatomical Record, 2007 Jul;290(7):825-30
Sexual dimorphic characteristics, which play an important role in human evolution studies and biological research, can be studied morphologically and metrically. Geometric morphometrics allows a better assessment of morphological characteristics. Statistical shape analysis has a long history in neuroanatomical and other research. The aim of this study was to identify shape differences of the corpus callosum between genders. Landmark coordinate data were collected from two-dimensional magnetic resonance imaging scans of 93 homogeneously aged patients, 45 men and 48 women. These data were analyzed using Euclidean distance matrix analysis and thin plate spline analysis. The general shape variability of the corpus callosum of men was greater than that of women (men, 0.134; women, 0.097). We found no significant difference between sexes in the general shape of the corpus callosum, but we did find significant differences in the distances between some landmarks. Deformation of the corpus callosum between men to women was mainly detected in the posterior of the corpus callosum. These results serve as a reference for future studies on shape alterations of the corpus callosum associated with certain conditions.
ERCAN I, Etoz A, Guney I, Ocakoglu G, ST Ozdemir, Kan I, Kahveci R.
Statistical shape analysis of nose ın Turkish young adults.
The Journal of Craniofacial Surgery, 2007 Jan;18(1):219-224.
There are several anthropometric studies regarding the nose, however none of them involves data about a statistical shape analysis. In this study, a landmark-based geometric morphometric technique was used to analyze the nasal shapes in a young Turkish adult population.A population of 75 female and 75 male volunteer Turkish young adults whose ages ranged 18-39 years (24.82 +/- 5.64 year) was examined. The stratified sampling method was used to determine the subjects according to the seven main geographic regions of Turkey. All data was obtained from standardized digital photographic images taken from anterior, lateral and inferior aspects by using standard anthropometric measurement methods. Euclidean Distance Matrix Analysis (EDMA) is used to calculate all possible linear distances among landmarks by creating matrixes for each subject.Today, the anthropometric methods and surgical practice intersected at a point to treat the congenital or post-traumatic facial disfigurements in various racial or ethnic groups. Rhinoplasty surgeons require access to facial databases based on accurate anthropometric measurements to perform optimum correction in both sexes. There should be some points brought to mind during the cosmetic nasal surgery for men because of different expectations, which is not technically different from the one for women. This study is a way to clarify these important points and a basis for further clinical studies enhancing the plans of the corrective surgery.
PRESENTATIONS
Ozkaya G, Ercan I, Sigirli D.
Examining Type I Error Rates for Hotelling T2 Test Applied to Bookstein Coordinates in Case of Changing
Reference Landmarks
5th International Conference of the ERCIM WG on Computing & Statistics. 1-3 December, 2012, Oviedo, Spain.
In many biological and biomedical investigations, the most effective way to analyse the forms of whole biological organs or organisms is by recording geometric locations of landmark points. If we want to compare shapes, individuals should be translated, rotated and scaled in such a way that all the individuals lay in the standard position and center. Bookstein (1984) carried out this by choosing two landmarks as baseline landmarks. Each individual translated, rotated and scaled according to these baseline landmarks. In this study it is aimed to examine if there are differences in the results of Hotelling T2 test, in case of choosing different baseline landmarks. Simulations showed that, in the 0.01, the type I error rate of Hotelling T2 test which was performed for Bookstein coordinates obtained by taking different landmarks as baseline, was quite consistent in the level of 0.05. But in high variance level, type I error rates of Hotelling T2 test were obtained lower than the determined nominal level. In case of comparing maximum percentage changes of p values according to landmark number, while there were found no differences for low variance level, there were found differences for all of them for high variance level. From there, it can be concluded that, it should be thought well whether increasing the landmark number in high variance level.
Ocakoglu G, Ercan I
Type I Error Rate According to Number of Landmark for Two-sample Tests in Statistical Shape Analysis
5th International Conference of the ERCIM WG on Computing & Statistics. 1-3 December, 2012, Oviedo, Spain.
In many biological and biomedical investigations, the most effective way to analyze the forms of whole biological organs or organisms is by recording geometric locations of landmark points. Therefore it is of great importance to compare shapes of the organs or organisms. Statistical shape analysis is a geometrical analysis of the statistics measured from sets of shapes that determines the features of similar shapes or of different groups comprising similar shapes. Newly developed methods utilize two-sample tests in statistical shape analysis which is a geometric morphometric concept. The Hotelling T2, Goodall F and James Fj tests as well as the lambda test statistic are used to compare the mean shapes of two samples from the statistical shape analysis literature according to type I error rates. Additionally, related tests performances are compared in terms of number of landmarks.
Ocakoglu G, Ercan I
Type I Error Rate for Two-Sample Tests in Statistical Shape Analysis
8. International Symposium of Statistics. 11-13 Ekim, 2012, Eskişehir, Türkiye .
Shape is defined as all the geometrical information that remains when location, scale and rotational effects are filtered from an object. Statistical shape analysis is a geometrical analysis of the statistics measured from sets of shapes that determines the features of similar shapes or of different groups comprising similar shapes. Distance between shapes, mean shape and shape variation can be predicted and obtained using statistical shape analysis. Methods concerning two-sample tests have been developed for statistical shape analysis, giving rise to considerable interest in research that evaluates the performance of these tests. In this study, the Hotelling T2, Goodall F and James Fj tests are used to compare the mean shapes of two samples from the statistical shape analysis literature according to type I error rates derived from various sample sizes. This simulation study considers isotropic case for which tangent space is used as shape space. The results of the present study indicate that tests perform better with large samples than with small samples. For all sample size levels, permutation test adaptations gave the most favorable results. It was concluded that bootstrap adaptations of tests gave the most unfavorable results in all isotropic covariance structures in small samples.
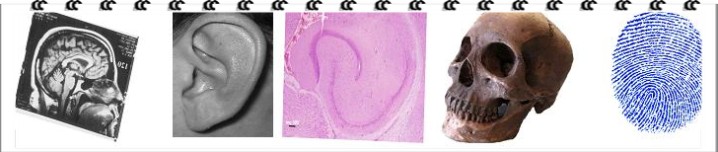
Ercan I, Gulsoy F, Ozkaya G, Ozel AS
Comparing Dependent Groups Using Bezier Curves In Statistical Shape Analysis: An Application Of On Twins Fingerprints
Inönü Üniversitesi Uluslararası Diş Hekimliği Kongresi, 26-28 Nisan, 2012, Malatya, Türkiye.
5th Conference of the Eastern Mediterranean Region of the International Biometric Society from May 10 to 14, 2009 in İstanbul, Turkey.
Our study has two goals. First, proposing a methodology comparing dependent groups using Bezier curves in shape analysis studies theoretically and secondly, in application comparing twins fingerprint in a different way. Therefore, in our study we marked 10 landmarks on fingerprints of two twins and different four subjects who have the same fingerprint type with twins. For removing translating, rotating and scaling effect, transformation was applied to Bookstein coordinates (superimposition). Bezier curves were determined according to reference landmarks as a control point marked on each fingerprint. Statistical comparison was performed on slope, arch length and width which were derived from Bezier curves. According to analysis result there is no similarity on twins fingerprints.
a
a
a
a
a
a
a
a
a
a
a
a
a
a
a
a
a
a
a
a
a
a
a
a
a
a
a
a
a
a
a
a